CQG Integrated ClientとCQG QTraderでは、バージョン2020以降より、現在と同じ日付における過去の価格をチャートに描画する、Seasonal Studyが利用可能になりました。本記事では、Seasonal Studyの使い方をご案内します。
チャートが日足のつなぎ足であるか確認します。チャート上部に「Daily Continuation」と表記されていれば問題ございません。
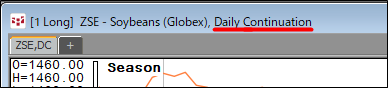
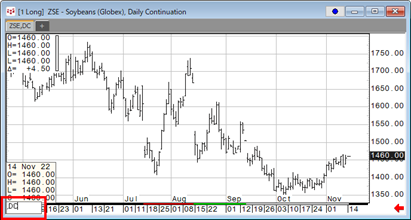
「Daily Continuation」が表記されていない場合、チャートをクリックし、「,DC」と入力後Enterキーを押すことで日足のつなぎ足表示に変更することができます。入力するとチャート左下にテキストボックスが表示されます。
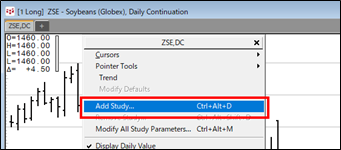
チャートを右クリック>「Add Study」を選択します。
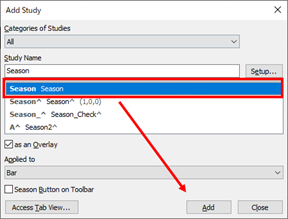
ダイアログ上部の「Study Name」欄に「Season」と入力し検索します。検索結果内の「Season」を選択後、「Add」をクリックします。
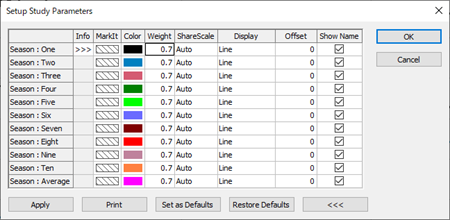
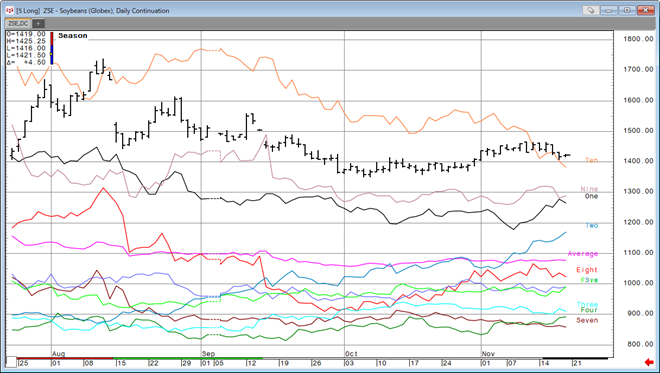
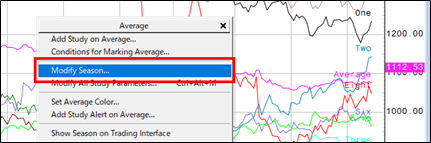
デフォルトでは、過去10年の同時期における価格、及び過去10年の平均値が描画されます。いずれかの線上にカーソル置き右クリック>「Modify Seasonal」を選択すると、パラメータ設定画面が開きます。
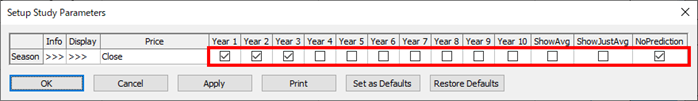
パラメータ設定画面のチェックを外すことで、特定の過去の価格を非表示にできます。年数以外のパラメータからは以下の設定ができます。
「ShowAvg」…チェックを入れた過去の価格の平均値が描画されます。
「ShowJustAvg」…「ShowAvg」にチェックを入れた時のみ機能します。過去の価格は非表示になり、チェックを入れた過去の価格の平均値のみ描画されます。
「NoPrediction」…将来の日付における過去の価格を非表示にします。
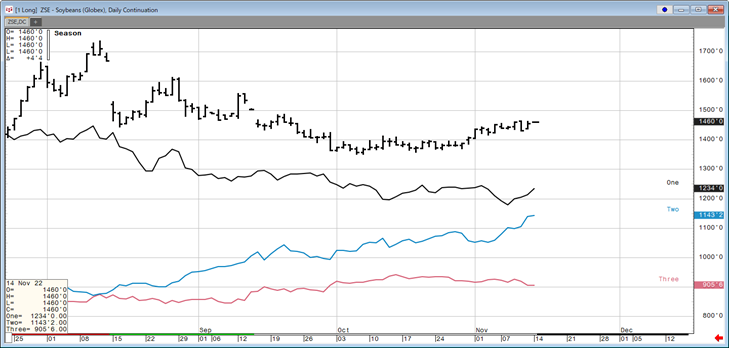
上記スクリーンショットでは過去3年間の価格を描画し、将来の日付における過去の価格を非表示に設定しました。このような設定では、以下のようなチャートになります。
パラメータ設定画面「Display」列の ![]() をクリックすると、各価格の色を「Color」から、ラインの太さを「Weight」から設定できます。
をクリックすると、各価格の色を「Color」から、ラインの太さを「Weight」から設定できます。