対象製品:CQG Integrated Client, CQG QTrader
CQGでは、チャート上に表示させたスタディを板画面に反映させることができます。これにより、スタディの値を参考に発注の判断を行っていただけます。
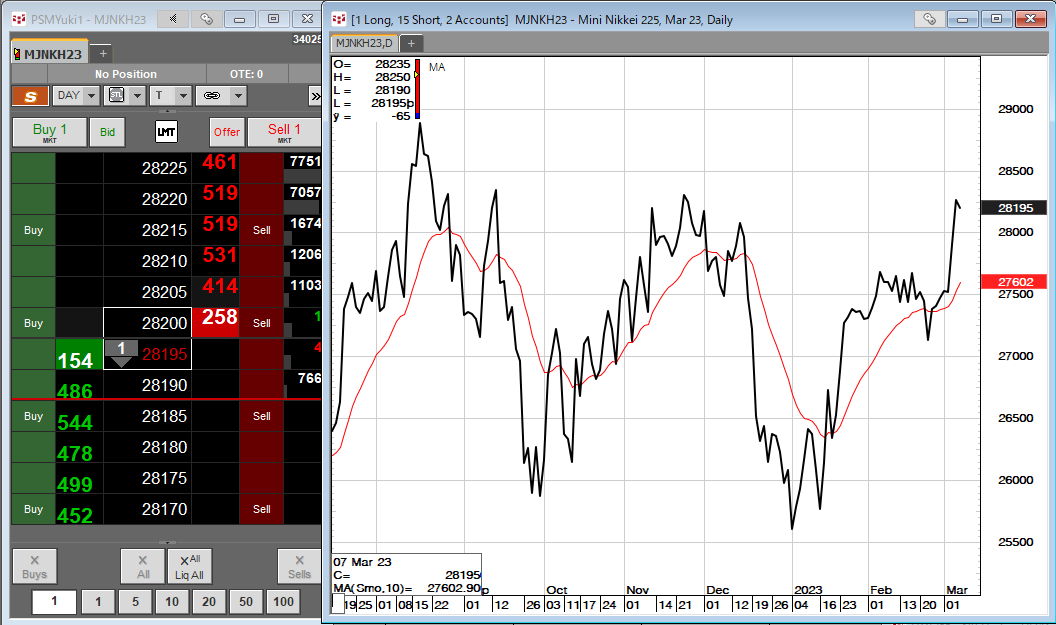
図1では、OSE日経225先物ミニの板画面を左側に、同銘柄の値動きを表す実線(黒線)と移動平均線(赤線)を描画したチャートを右側に表示しています。
図1
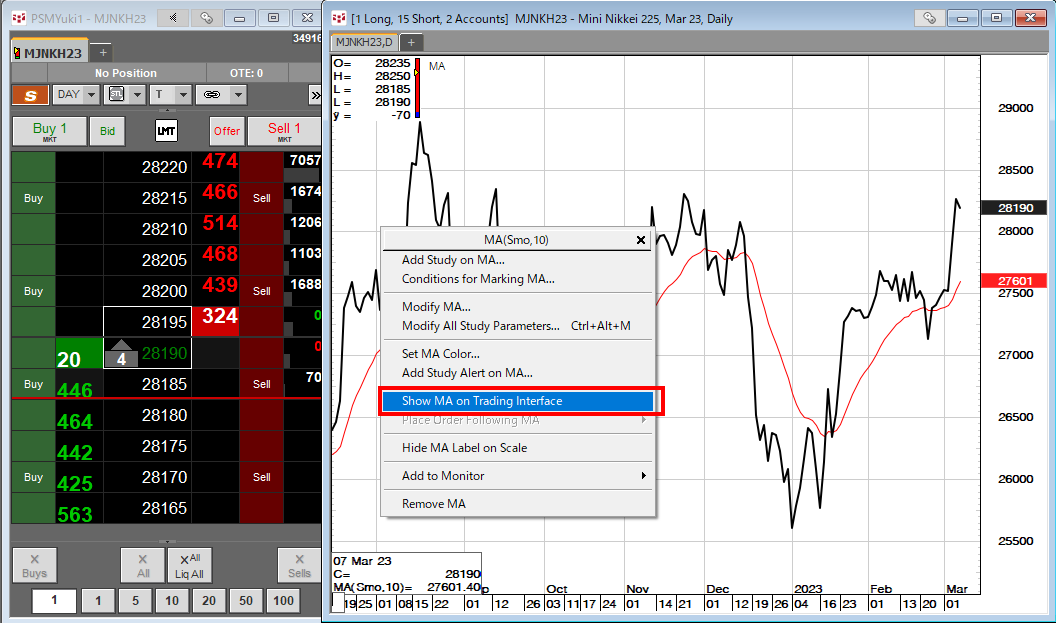
移動平均線の上にカーソルを置き右クリック後、「Show MA on Trading Interface」をクリックします。(図2)
図2
スタディの値が板画面表記の範囲外(28170-28225)にありますので、図3のように板画面下部にアイコンが出現します。クリックすると、スタディの値が表記されている価格が表示され、アイコンがついていることが確認できます。(図4)
図3
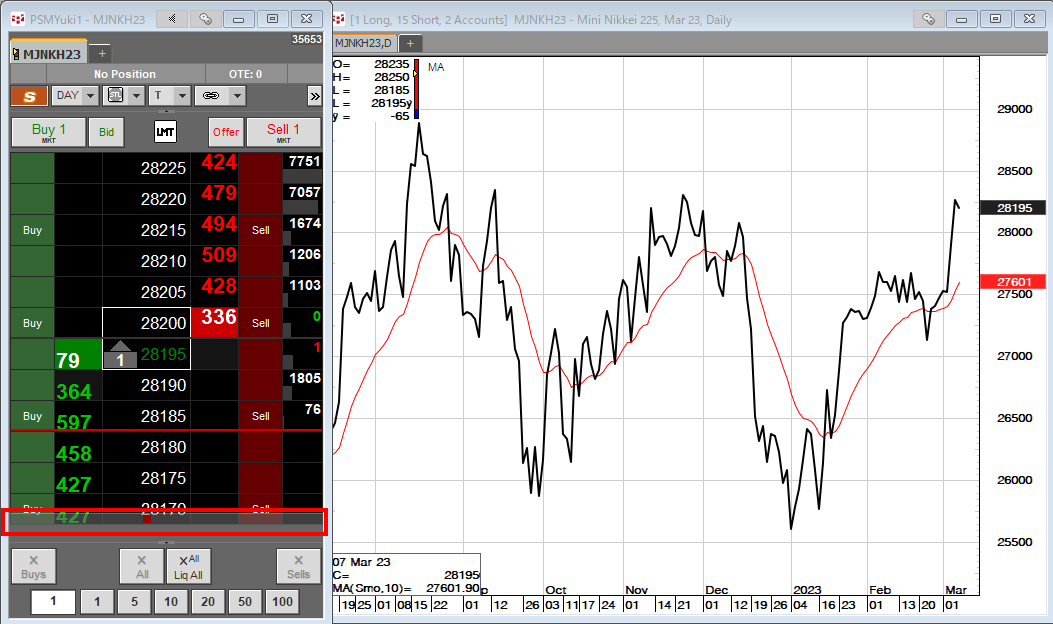

図4
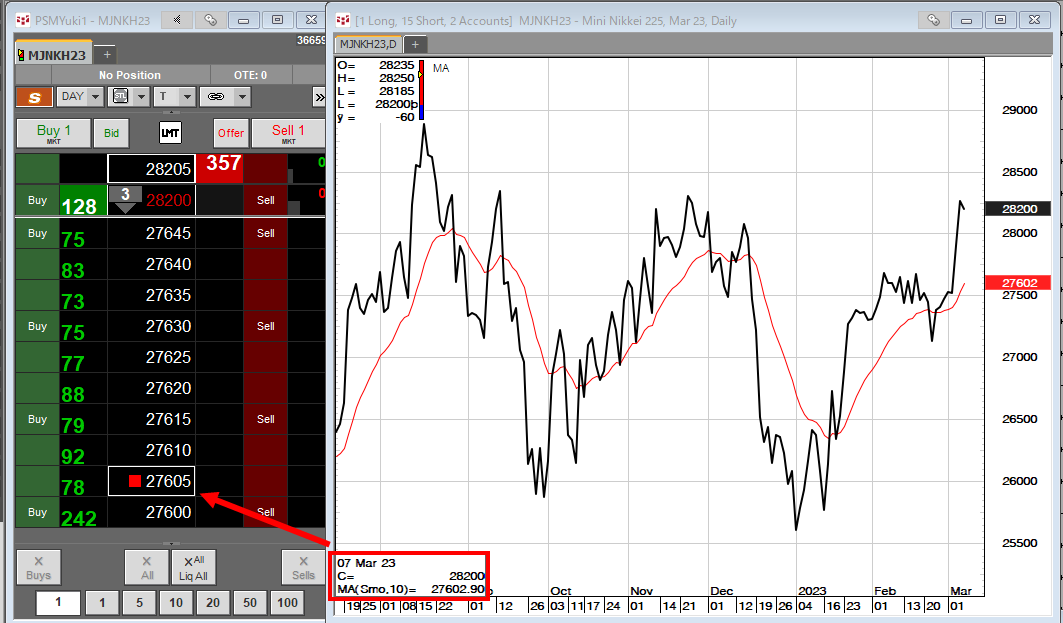
図4のチャート左下にて、移動平均線の値が27602.90であることがわかります。デフォルトの設定ではこの値に最も近い価格へアイコンがつきます。
図5のように、板画面上のアイコンを右クリックし、「MA study value rounding」から切上げ、切り下げ方法を指定することができます。
図5
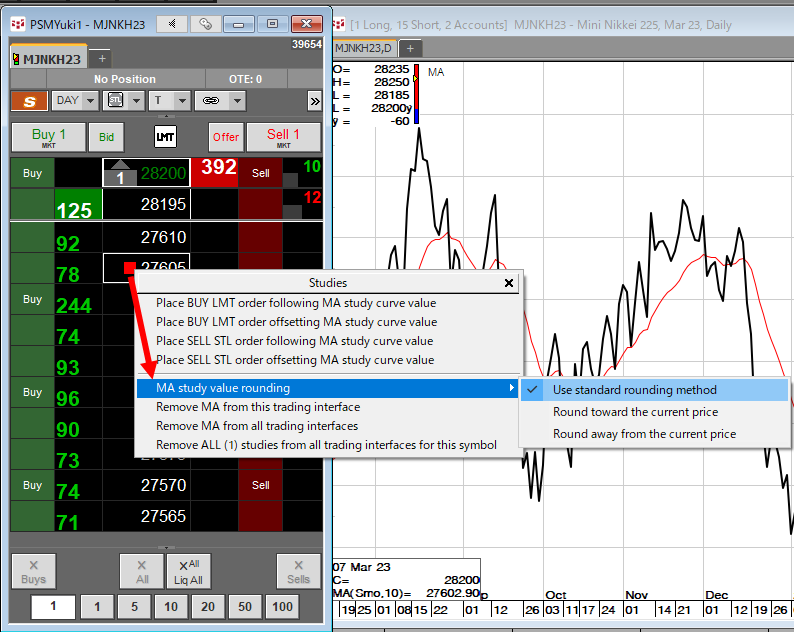
「Use standard rounding method」…スタディの値に最も近い価格にアイコンがつきます。
「Round toward the current price」…スタディの値を銘柄の呼び値で切り上げた価格にアイコンがつきます。
「Round away from the current price」スタディの値を銘柄の呼び値で切り下げた価格にアイコンがつきます。
作成日:2023/3/9
お問合せ先
こちらの記事に関するご質問は、tokcsp@cqg.com までご連絡ください。