このレポートは、毎週水曜日(米国時間)に、季節性を考慮したCQGのSeasonal Studyを用いて、大豆、小麦、トウモロコシ市場を分析します。Seasonal StudyのCQG用PACファイルはこちらから、またExcelへRTDを利用し引用することが可能です。
各穀物チャート下には表があります。上部の表は20日、50日、100日、200日間分のデータを対象に、それぞれの期間において過去10年間の価格推移を参照し、現在の価格推移ともっとも相関性の高い価格推移データの年数、また相関値を掲載しています。
大豆
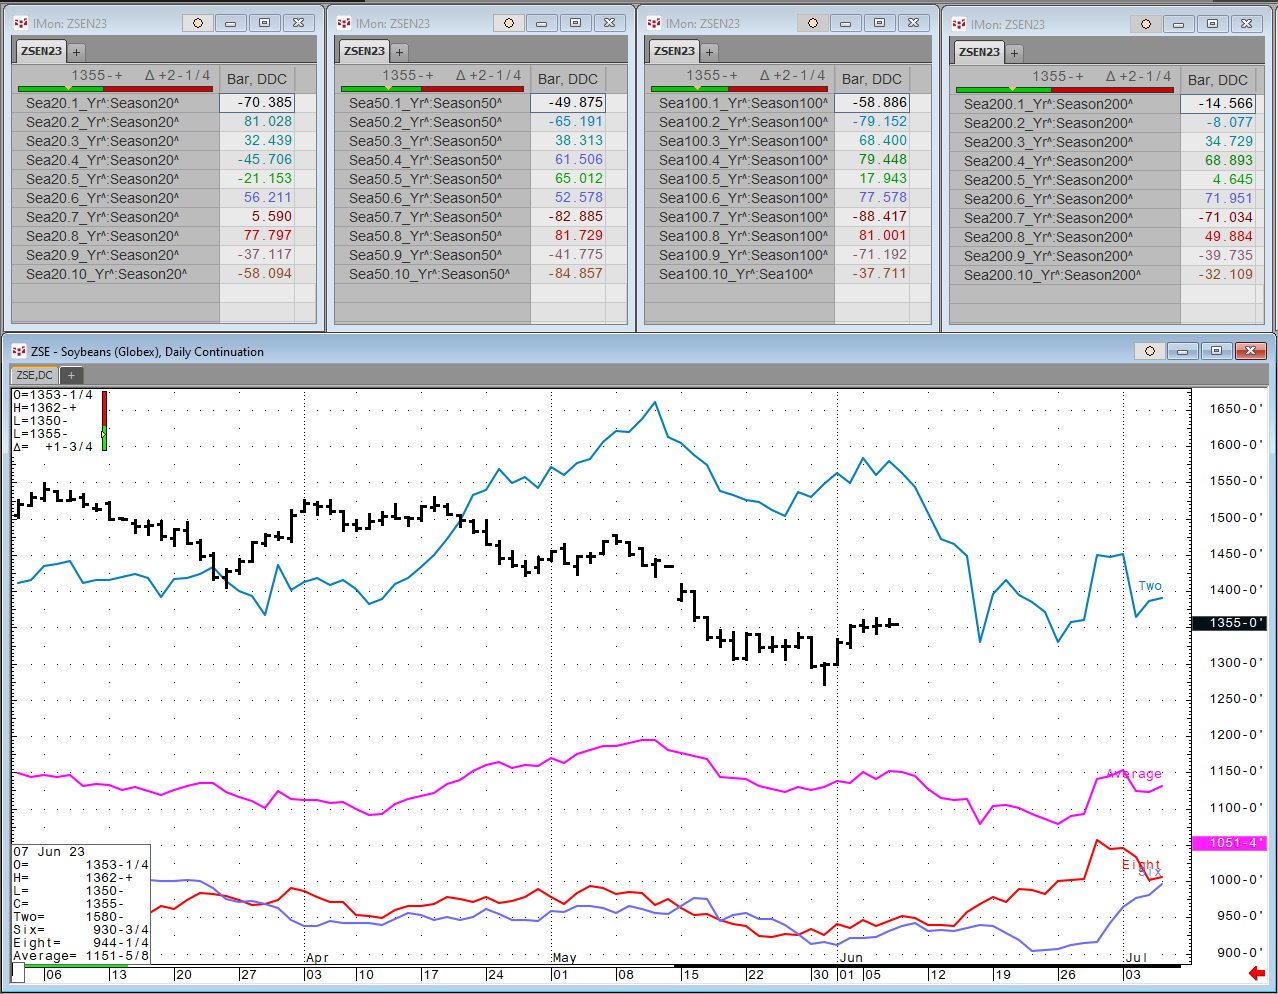
今週 | ||||
相関対象期間(日) | 20 | 50 | 100 | 200 |
最高相関(過去10年) | 2年前 | 8年前 | 8年前 | 6年前 |
先週 | ||||
相関対象期間(日) | 20 | 50 | 100 | 200 |
最高相関(過去10年) | 8年前 | 8年前 | 4年前 | 6年前 |
小麦
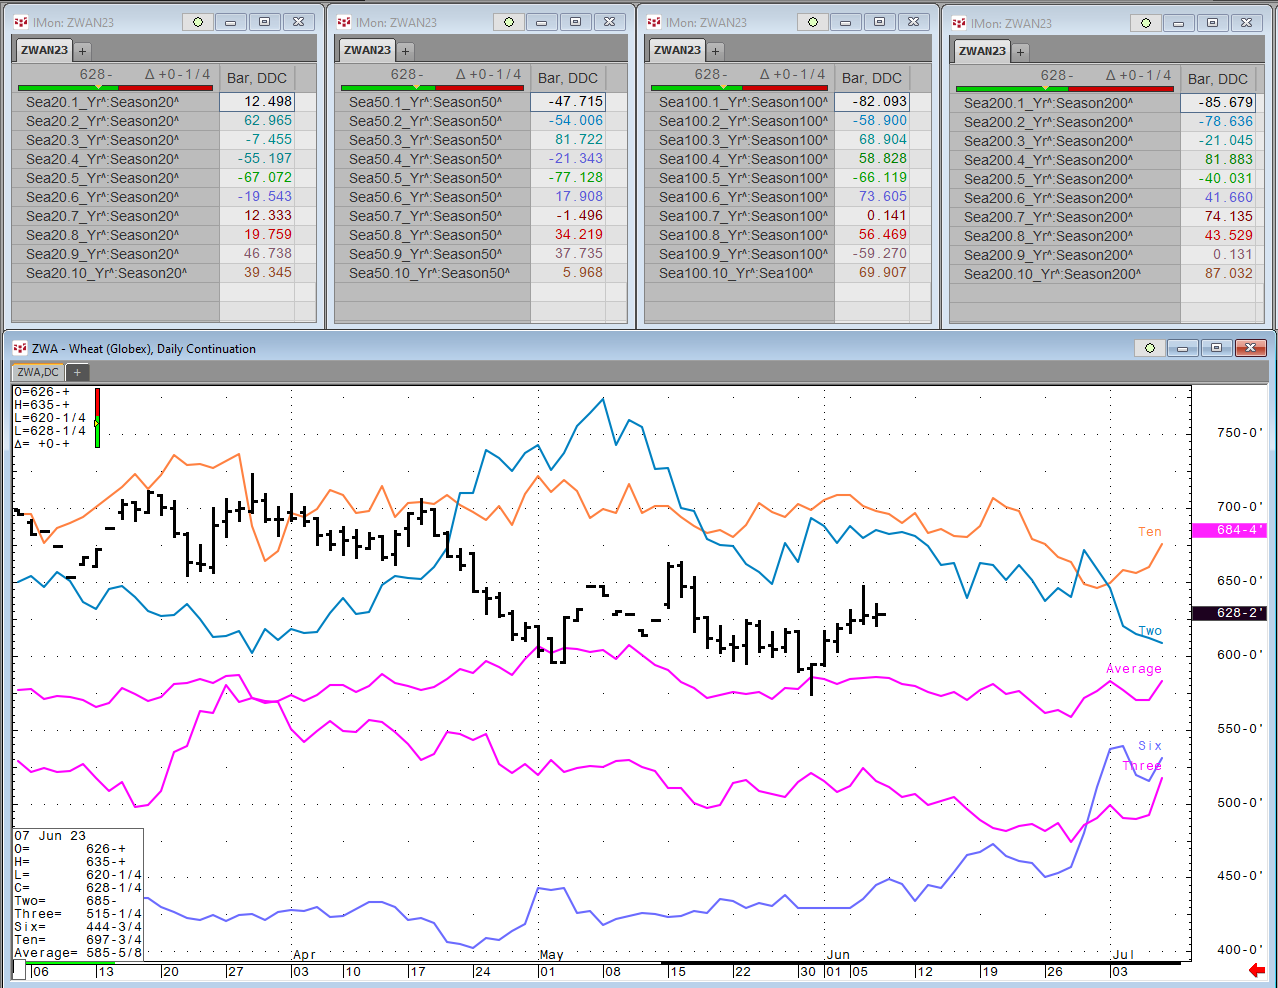
今週 | ||||
相関対象期間(日) | 20 | 50 | 100 | 200 |
最高相関(過去10年) | 2年前 | 3年前 | 6年前 | 10年前 |
先週 | ||||
相関対象期間(日) | 20 | 50 | 100 | 200 |
最高相関(過去10年) | 9年前 | 3年前 | 6年前 | 10年前 |
とうもろこし
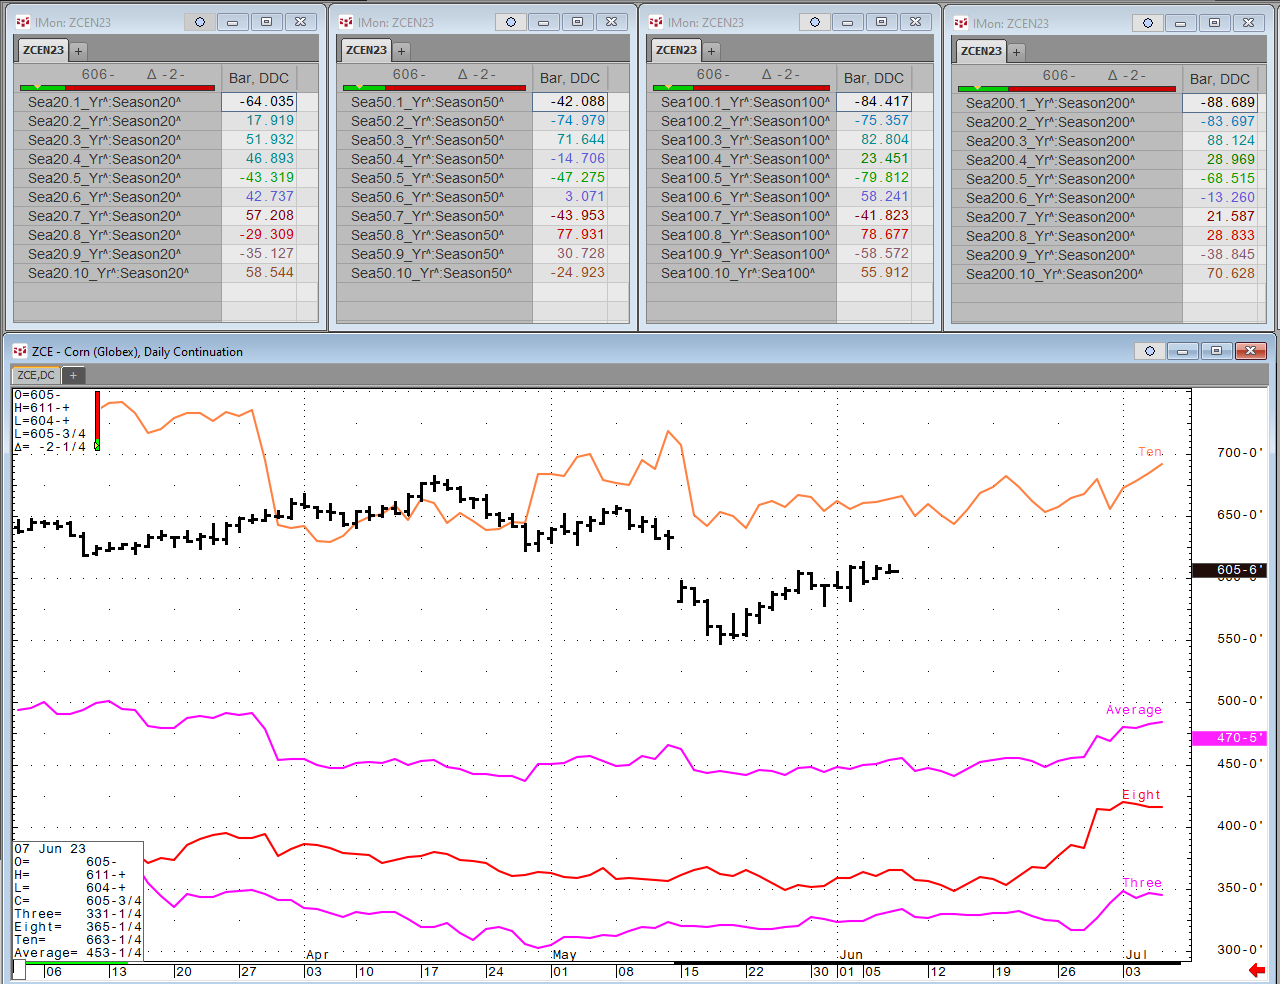
今週 | ||||
相関対象期間(日) | 20 | 50 | 100 | 200 |
最高相関(過去10年) | 10年前 | 8年前 | 3年前 | 3年前 |
先週 | ||||
相関対象期間(日) | 20 | 50 | 100 | 200 |
最高相関(過去10年) | 9年前 | 8年前 | 3年前 | 3年前 |