穀物ウィークリーレポート (7/20/22)

このレポートは、毎週水曜日(米国時間)に、季節性を考慮したCQGのSeasonal Studyを用いて、大豆、小麦、トウモロコシ市場を分析します。Seasonal StudyのCQG用PACファイルはこちらから、またExcelへRTDを利用し引用することが可能です。

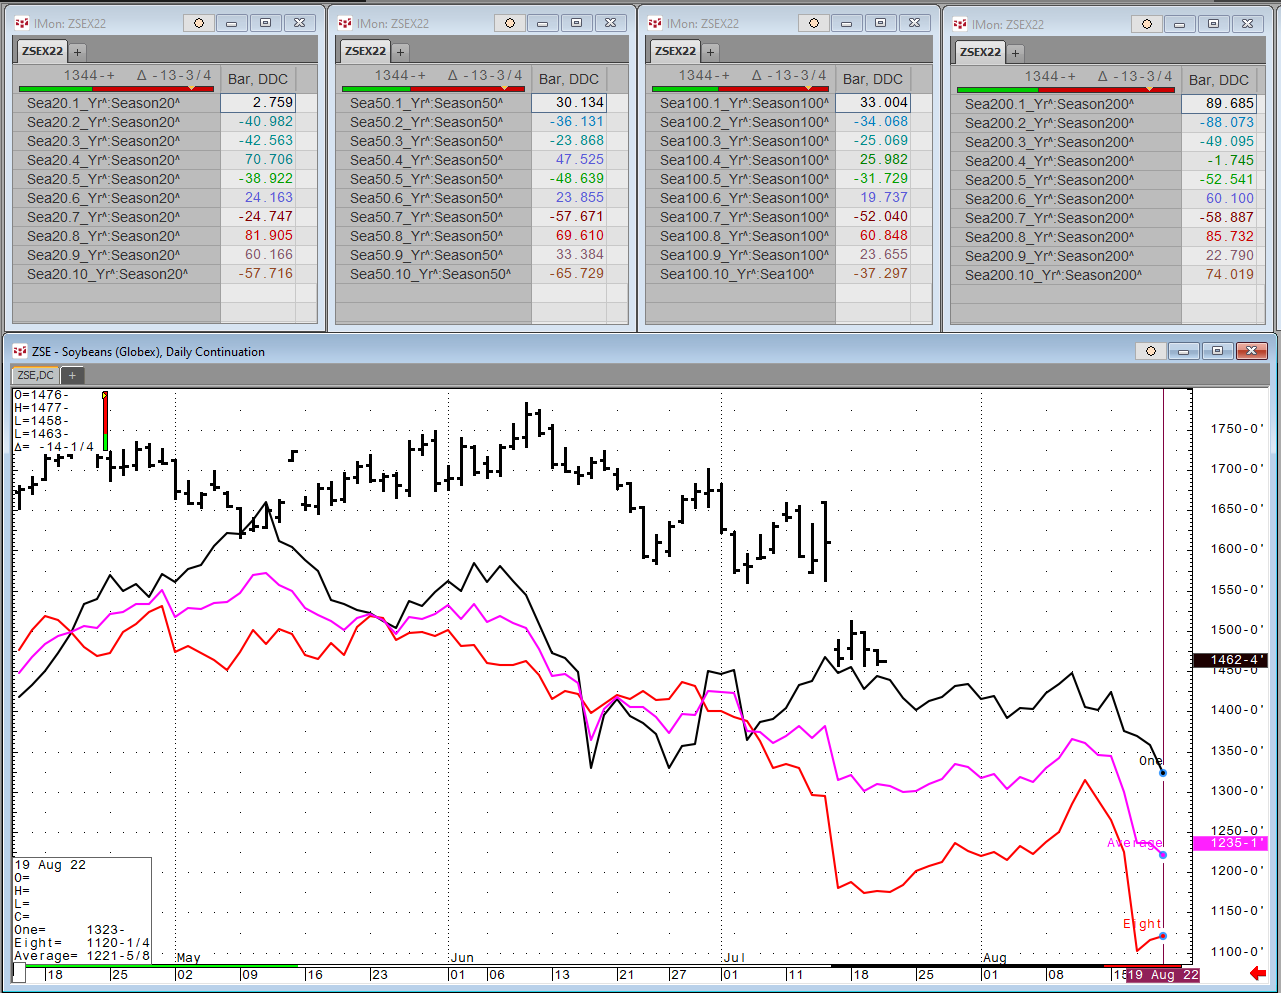
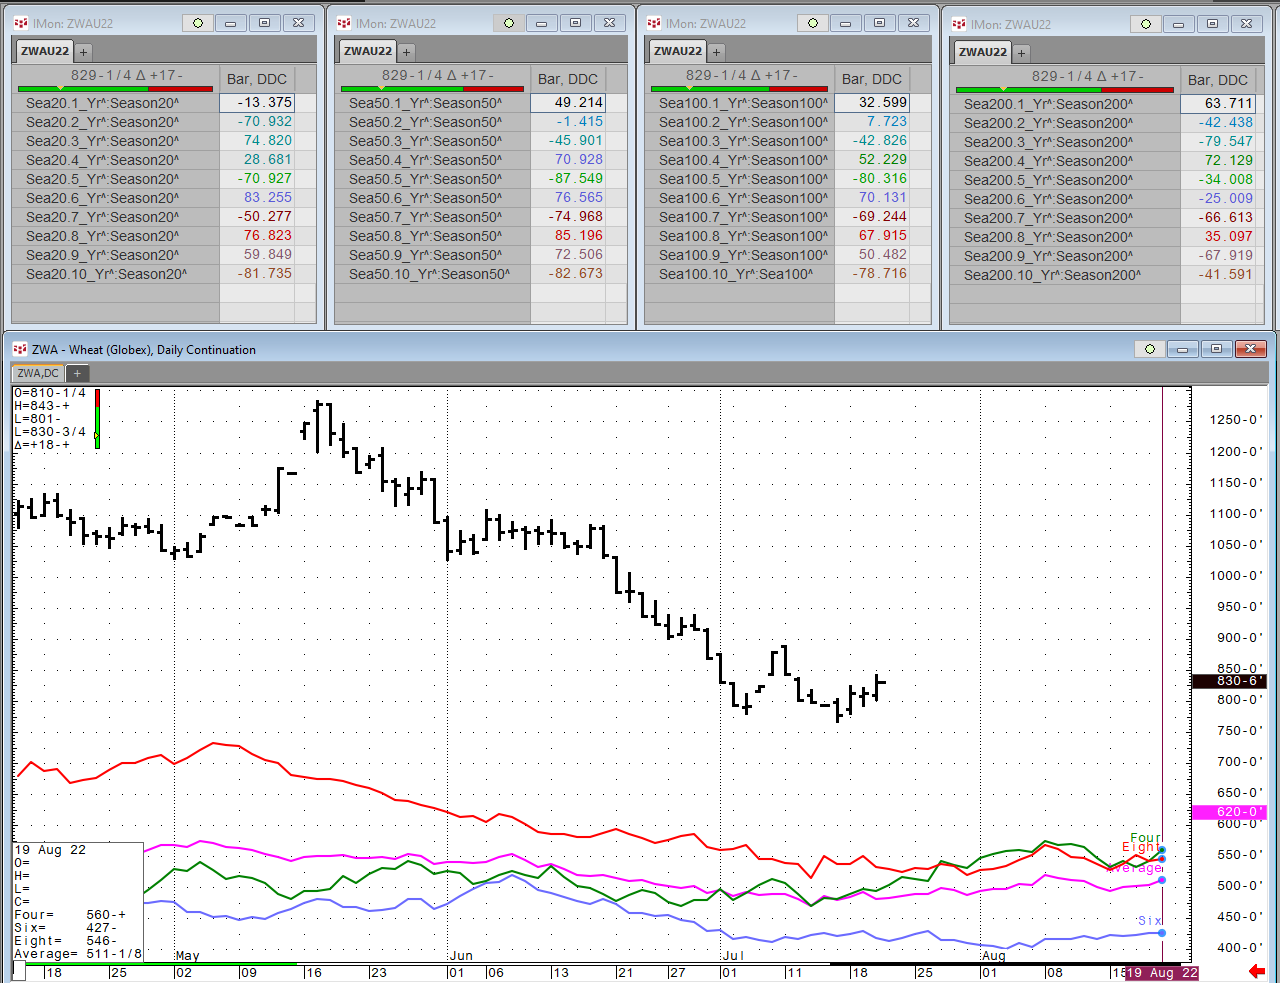
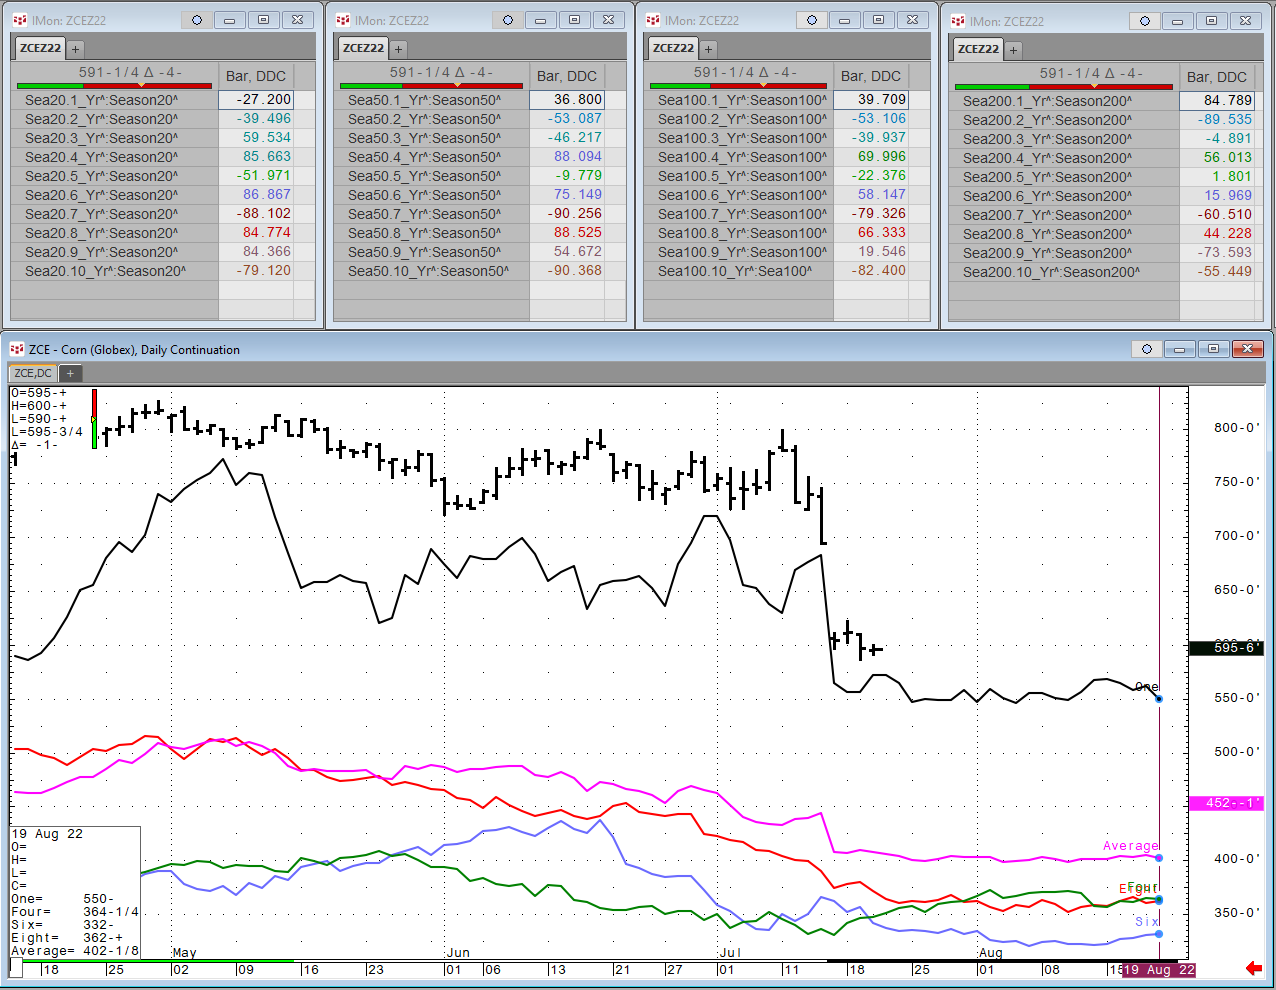
各穀物チャート下には表があります。上部の表は20日、50日、100日、200日間分のデータを対象に、それぞれの期間において過去10年間の価格推移を参照し、現在の価格推移ともっとも相関性の高い価格推移データの年数、また相関値を掲載しています。

大豆

Soybean

今週


相関対象期間(日)

20

50

100

200

最高相関(過去10年) 

4年前  
70.71

8年前  
69.61

8年前  
60.85

1年前  
89.69

先週


相関対象期間(日)

20

50

100

200

最高相関(過去10年) 

4年前  
74.98

8年前  
43.47

8年前  
45.33

1年前  
89.86

小麦

Wheat


今週


相関対象期間(日)

20

50

100

200

最高相関(過去10年) 

6年前  
83.26

8年前  
85.20

6年前  
70.13

1年前  
72.13

先週


相関対象期間(日)

20

50

100

200

最高相関(過去10年) 

6年前  
93.38

8年前  
73.87

8年前  
63.17

4年前  
65.42

とうもろこし

Corn

今週


相関対象期間(日)

20

50

100

200

最高相関(過去10年) 

4年前  
86.87

8年前  
88.53

1年前  
70.00

1年前  
84.79

先週


相関対象期間(日)

20

50

100

200

最高相関(過去10年) 

4年前  
58.84

8年前  
59.90

1年前  
63.94

1年前  
90.65

  • Seasonal Studyの設定方法については、こちらをご参照ください
  • 英語の原文はこちらからご覧ください

Disclaimer

Trading and investment carry a high level of risk, and CQG, Inc. or its affiliates do not make any recommendations for buying or selling any financial instruments. We offer educational information on ways to use our sophisticated CQG trading tools, but it is up to our customers and other readers to make their own trading and investment decisions or to consult with a registered investment advisor. The opinions expressed here are solely those of the author and do not reflect the opinions of CQG, Inc. or its affiliates.